In deep learning, there is a dangerous temptation to treat training data as absolute truth. When a complex architecture fails to converge or overfits horribly, our default engineering instinct is to tweak hyperparameters, add dropout, or throw a heavier model at the problem.
But what if the model isn't the problem? What if the labels themselves are systematically broken?
Recently, our team set out to build an infant cry classifier using the official Donate-a-Cry corpus. Our goal was simple: train a ResNet model on acoustic audio features to predict why a baby is crying (e.g., hunger, pain, discomfort, tiredness). Instead, we hit a wall of severe, unresolvable overfitting.
1. The Baseline: Feature Extraction and the ResNet Wall
Our pipeline started conventionally. We processed the raw audio files from the Donate-a-Cry dataset and extracted Mel-Frequency Cepstral Coefficients (MFCCs) alongside other spectral features to capture the timbre, pitch, and texture of the audio.
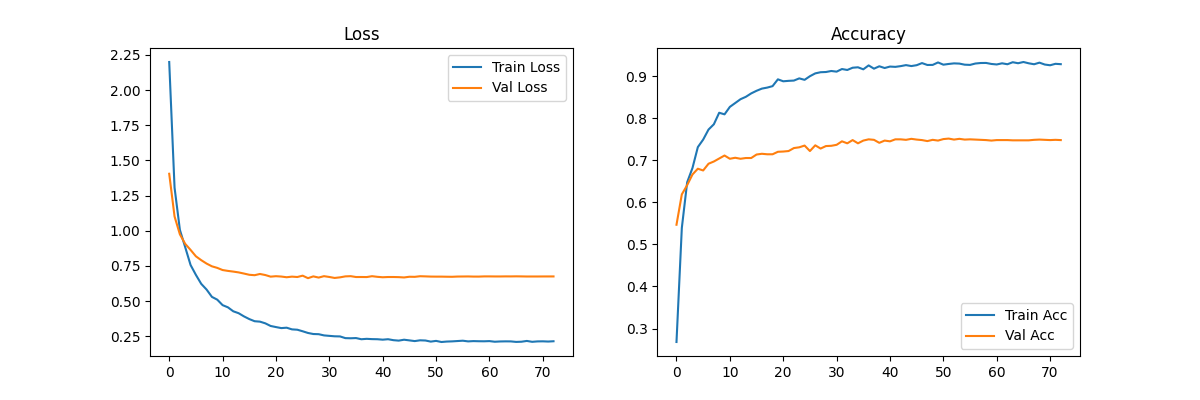
We fed these feature maps into a ResNet architecture, expecting the deep convolutional layers to easily pick up on the nuances of different cry types. Instead, the training curves exposed a massive architectural wall:
As shown in the training history, the model hits a severe divergence point almost immediately:
-
Training Metrics: The training loss smoothly approaches zero while training accuracy hits a perfect 1.0 (100%).
-
Validation Metrics: The validation accuracy completely flatlines around 70%, while the validation loss undergoes a catastrophic exponential spike.
No amount of regularization, dropout, or learning rate tweaking could bridge this gap. The model wasn’t learning generalized acoustic features for "hunger" or "pain"—it was forced to brute-force memorize the specific audio signatures of the training set just to satisfy the conflicting labels.
2. Investigating the Latent Space: The "Hungry" Blanket Label
To diagnose the bottleneck, we stopped modeling and started visualizing. We projected our high-dimensional audio features down to a 2D space using t-SNE, coloring the points by their original human-assigned folder labels.
The result was a textbook example of data chaos:
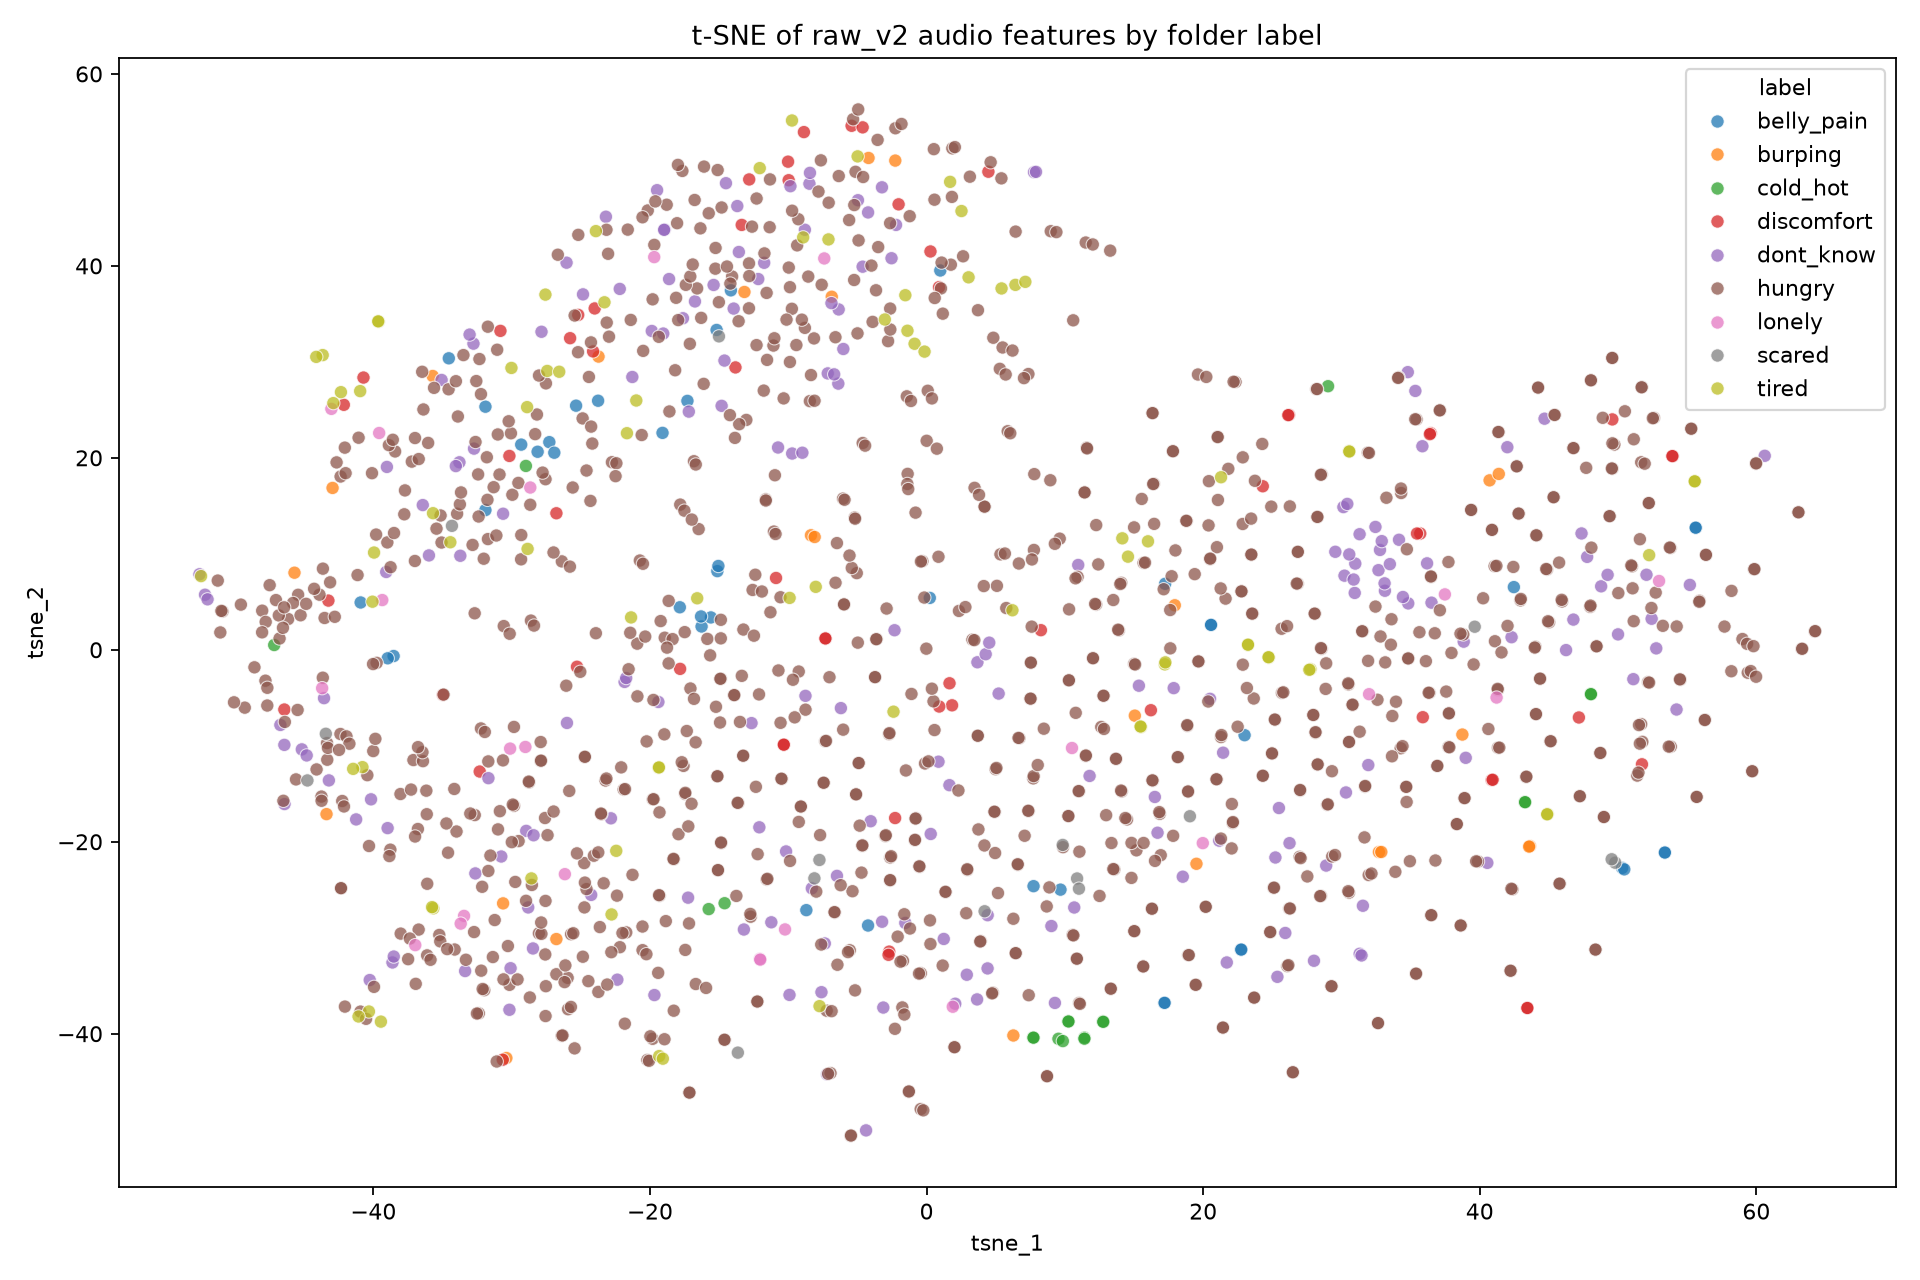
The plot is a giant, homogenous cloud dominated almost entirely by the "hungry" label (the brown points). Minor classes like discomfort, belly pain, cold/hot, and tired are completely swallowed up and randomly scattered inside this brown sea.
Acoustically, a cry labeled as "belly pain" is sitting right on top of a "hungry" cry. If a human cannot see a clear boundary in a low-dimensional t-SNE plot, a neural network is going to struggle to draw a clean mathematical decision boundary without resorting to brute-force memorization (overfitting).
3. Unsupervised Clustering: Letting the Audio Speak
We hypothesized that the feature representations did have structure, but the labels were introducing massive amounts of crowdsourcing noise. To test this, we stripped away the human labels entirely and handed the raw audio features to an unsupervised K-Means algorithm set to 9 clusters to match the original number of classes.
The results were a complete revelation:
When the algorithm is allowed to group data purely by acoustic similarity, the data forms distinct, beautifully localized regions. The data isn't random noise—the feature extraction pipeline successfully found distinct acoustic signatures!
However, when we looked at the underlying composition of these clusters, the systemic flaw in the dataset's ground truth was mathematically exposed:
| Cluster | Size (Samples) | Majority Label | Matches | Purity |
|---|---|---|---|---|
| 0 | 154 | hungry | 97 | 62.9% |
| 1 | 128 | hungry | 91 | 71.1% |
| 2 | 262 | hungry | 201 | 76.7% |
| 3 | 198 | hungry | 150 | 75.8% |
| 4 | 82 | hungry | 56 | 68.3% |
| 5 | 2 | tired | 2 | 100.0% |
| 6 | 185 | hungry | 114 | 61.6% |
| 7 | 259 | hungry | 190 | 73.4% |
| 8 | 311 | hungry | 225 | 72.3% |
Every single major cluster (0, 1, 2, 3, 4, 6, 7, and 8) has a majority label of "hungry."
This confusion matrix heat map visualizes this perfectly:
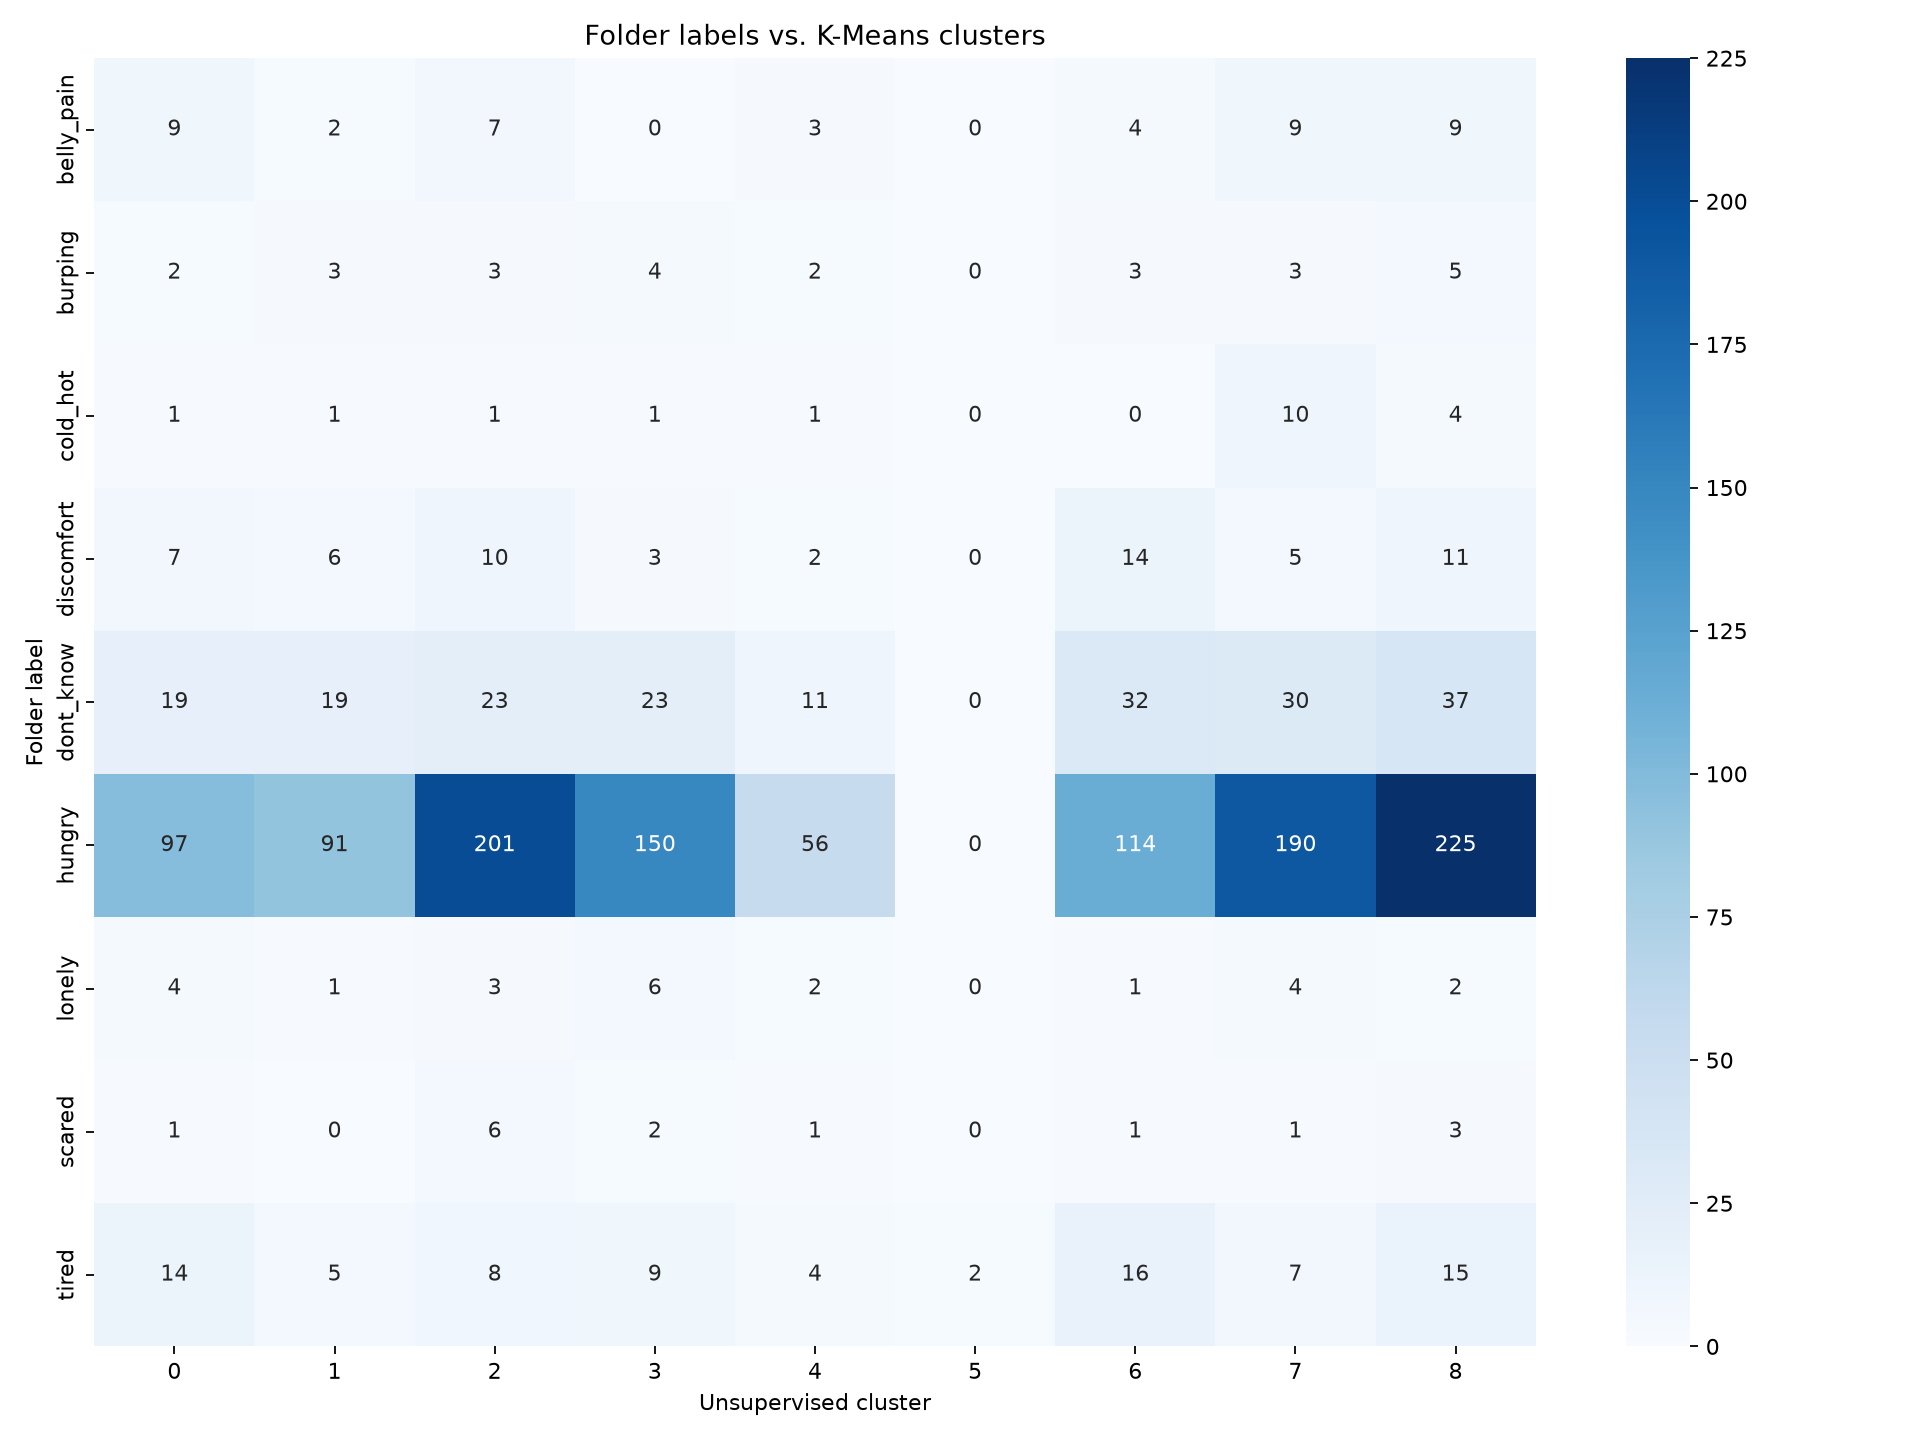
Because the Donate-a-Cry corpus relies on crowdsourced contributions from app users, we are seeing a massive cognitive confirmation bias. When a baby cries, the default, overwhelming human assumption is that the baby must be hungry. Whether the infant was actually experiencing discomfort, fear, or temperature changes, users overwhelmingly tagged the files as "hungry." Because this one label was applied blindly to completely different acoustic phenomena, it created an impossible task for the supervised ResNet model.
Conclusion: Never Follow Data Blindly
Our investigation proves that the primary bottleneck in classifying the Donate-a-Cry dataset isn’t algorithmic complexity—it’s label saturation and crowdsourcing noise.
The ultimate lesson here is clear: Following data blindly without thorough exploratory testing will mislead you. When your deep learning models fail to generalize, stop staring at your loss curves, step away from hyperparameter tuning, and start interrogating your data's latent space. Sometimes, the model isn't failing you; it's just refusing to believe a broken label.